Are you looking for “jaw-dropping” facts and statistics regarding dentistry in 2021? Look no further.
We’ve categorized and illustrated a list of up-to-date dental facts & stats below. Navigate using the content table on your right to jump to a category.
Weird Dental Facts
These are some of the weirdest dental facts we think you should know.

1) Jaw muscles can contract with a force of 55 up to 200 pounds of pressure [1].

2) In a lifetime, humans produce over 100,000 gallons of saliva [2].

3) Ape and human teeth have the same shape. [1].

4) The American Dental Association was formed In 1859 at Niagra Falls by 26 dentists [1].

5) Colgate first aromatic toothpaste was inside a jar in 1873. [1]


6) In a lifetime, the average American spends ~38.5 days in teeth brushing. About one month of brushing teeth. [2]

7) Tooth prints are unique to each person. Same as fingerprints. [2]

8) Dental floss is sturdy. And it has been used by prisoners to climb buildings and escape in 1994. [2]

9) Right-handed people tend to chew on the right side of the mouth, and left-handed people tend to chew on the left side. [2]

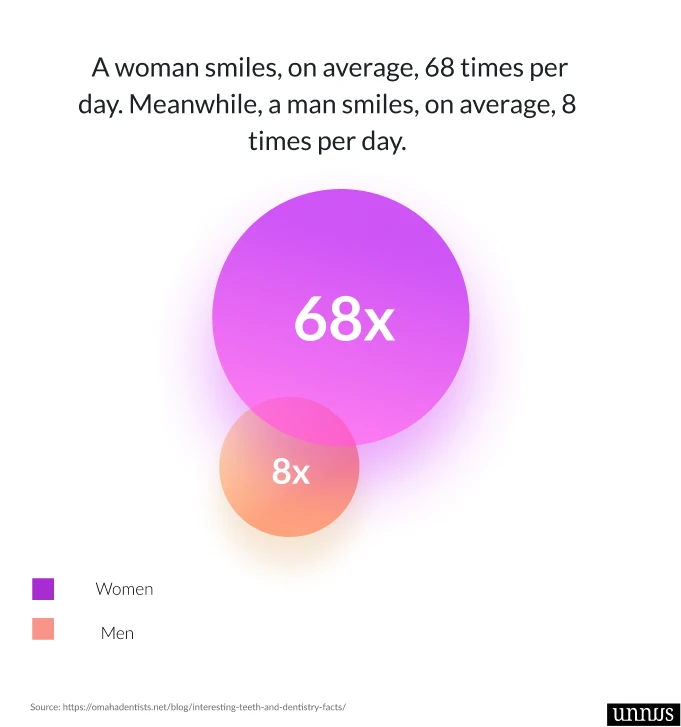
10) On average, the woman smiles 68 times in a day. While men smile 8 times a day. [2]

11) Americans buy more than 224 million cups (14 million gallons) of toothpaste annually. [3]

12) People prefer blue toothbrushes to red ones. [3]

13) It takes 43 muscles to frown and 17 to smile. [3]

14) By drinking 1 soda can each day, the average American gains 6.8 Killos yearly. [3]

15) The cotton candy machine was co-invented by a dentist. [3]

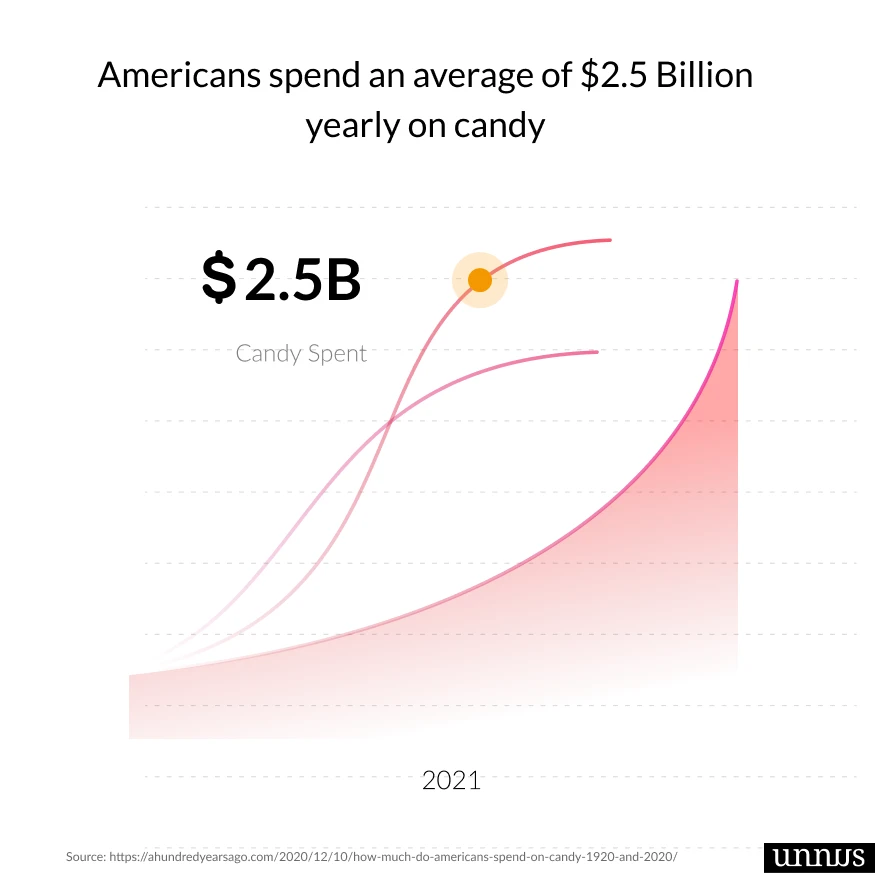
16) Americans spend an average of $2.5 Billion yearly on candy. After a peak in 2010 where candy consumption grossed $25 billion. [3]
Dental Statistics And Facts By Demographics & Ethnicity

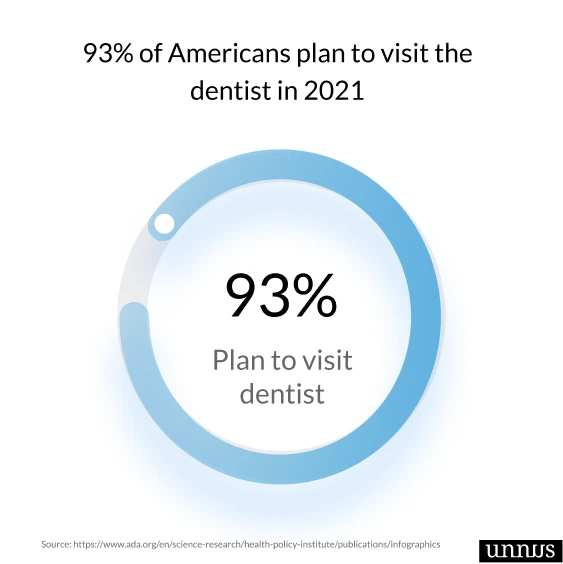
17) 93% of Americans plan to visit the dentist in 2021. [4]

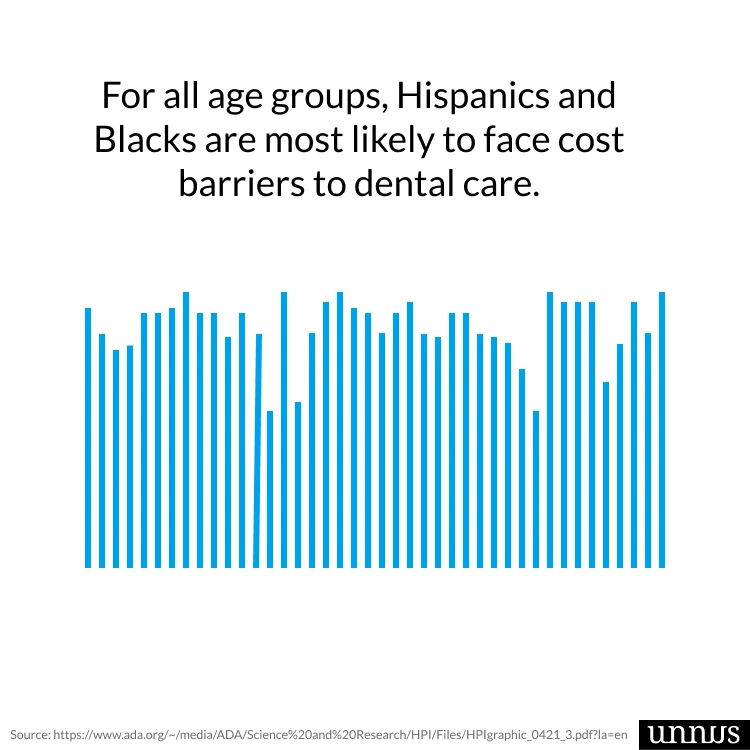
18) For all age groups, Hispanics and Blacks are most likely to face cost barriers to dental care. [5]

19) Roughly 25% of American adults have no teeth [3].

20) 95% of American adults with diabetes also have periodontal disease. [3]

21) Adult white people scored the highest percentage of dental visits in the past years followed by Asians. [5]

22) Racial disparities in dental care use are smallest for children and largest for seniors. [5]

23) In general, dental care use has increased over time for children and seniors, but not for adults. [5]

24) Cost barriers to dental care have fallen significantly for children while increasing for adults and seniors. [5]

25) Due to the pandemic, 90% of Americans think that maintaining oral hygiene is critical to their health. [4]

26) Nearly one-quarter of dental students are Asian, compared to 18% of dentists overall and 6% of the U.S. population. [5]

27) Educational debt levels for dental school graduates vary significantly by race. For example, more than 20% of Asian dentists graduate with no student debt compared to less than 1% of Black dentists. Black dentists, by far, graduate with the highest levels of educational debt. [5]
Pediatric Dental Facts

28) Children begin to develop their teeth in the womb — just 6 weeks after conception. [1]

29) An adult tooth that has been knocked out of your child’s mouth starts to die within 15 minutes, but if you put it in milk or hold it in your mouth under the tongue it will survive longer. [1]

30) Prehistoric children rarely have cavities because they don’t eat sugar. [1]

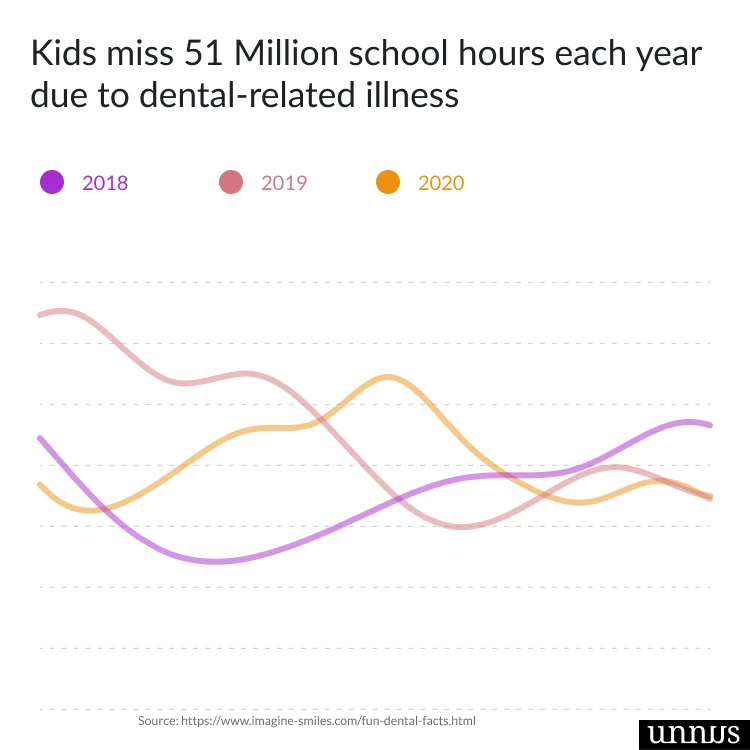
31) Kids miss 51 million school hours a year due to dental-related illnesses. [3]

32) About 74%-75% of school kids have dental cavities. [3]

33) Children smile an average of 400 times a day. [6]

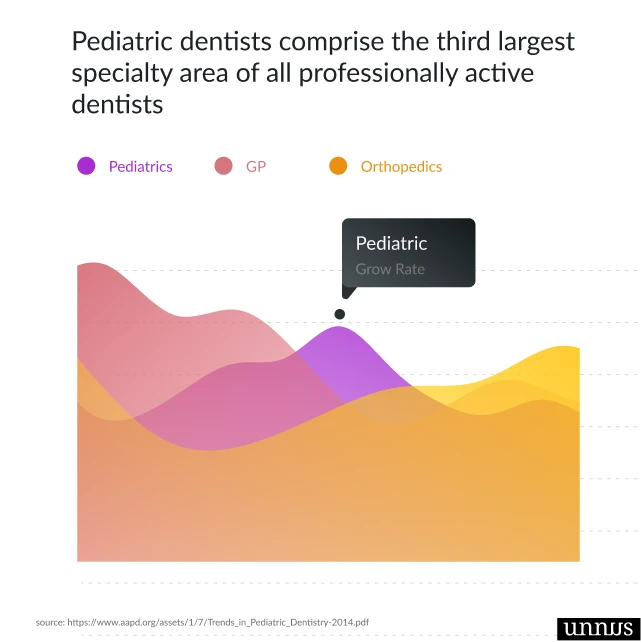
34) Pediatric dentists form the 3rd biggest specialty area and account for 3.3% of overall dentists. [5]

35) mothers-to-be with poor oral hygiene are 7X more likely to deliver premature babies. [3]
Dental Statistics Related To Covid-19

36) Patient volume was estimated at 81% of pre-COVID-19 levels on average. [7]

37) Staffing in dental offices was at 99% of pre-COVID-19 levels. [7]

38) Over the past month, the most common measure taken by dentists to maintain financial sustainability was raising fees. Others responded to the financial challenges of practice ownership by taking out loans. [7]

39) Dentists in large group practices have had to take fewer measures to maintain financial sustainability compared to those practicing solo. [7]

40) More than a third of dentists are practicing some form of teledentistry, most commonly to triage emergencies, do post-ops and follow-up care and for consults. [7]

41) Approximately 10% of dentists who were enrolled as Medicaid providers prior to the COVID-19 pandemic have since disenrolled. [7]

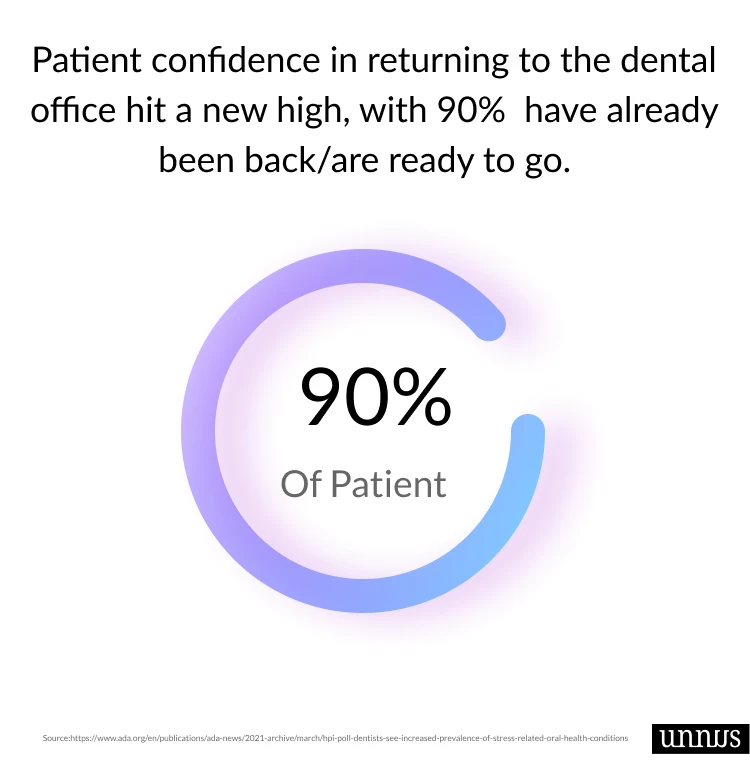
42) Patient confidence in returning to the dental office hit a new high, with 90% reporting to have already been back or are ready to go. [7]

43) Despite circulating myths from news outlets that mask-wearing may impact oral health and cause “mask mouth,” a recent survey by ADA found no meaningful change in the for conditions such as bad breath and dry mouth compared to pre-Covid-19. [7]

44) Dentists see more stress-related conditions during the pandemic. [7]

45) 40% of dentists think that cost/income will be the biggest challenge facing their practice. [7]

46) Nearly half of the dentists agree a drop in revenue has been the number #1 impact of the pandemic on their practice. [8]

47) 71% of dentists made use of the wage subsidy program to help sustain their practice. [8]

48) 51% of dentists agree the wage subsidy program was helpful in maintaining staffing levels. [8]

49) Of all dentists who charge a covid-19 fee, over 33% of them charge $10 or lower. [8]

50) Over 33% of dentists believe infection control/IPAC is the skill covid-19 allowed them to learn more about. [8]

51) About 50% of dentists have implemented teledentistry into their practice. [8]

52) 87% of dentists have not implemented a covid-19 fee for their patients. [8]

53) 46% of dentists are likely to continue using their teledentistry program once things go back to normal. [8]

54) Over 50% of dentists believe covid-19 has had an impact on their purchases of technology and equipment. [8]

55) 33% percent of dentists agree practice management is their biggest stressor. [8]

56) Moving forward, 94% of dentists agree their plans for CE are webinars and virtual online courses. [8]

57) Information about COVID cases in dental offices influences patient attendance. [10]

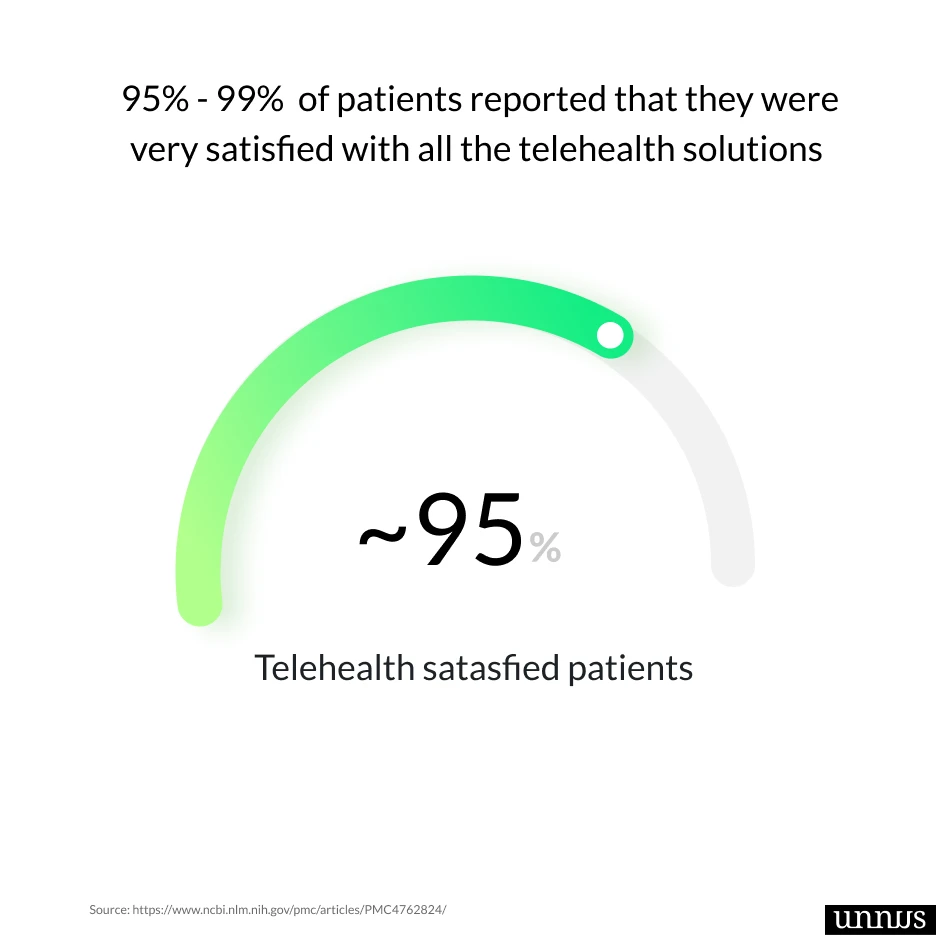
58) Nearly 99% of patients reported that they were very satisfied with all the telehealth attributes. [11]
Dental Industry Statistics

59) 72% of dentists choose referrals as a potent method to generate patients. [12]

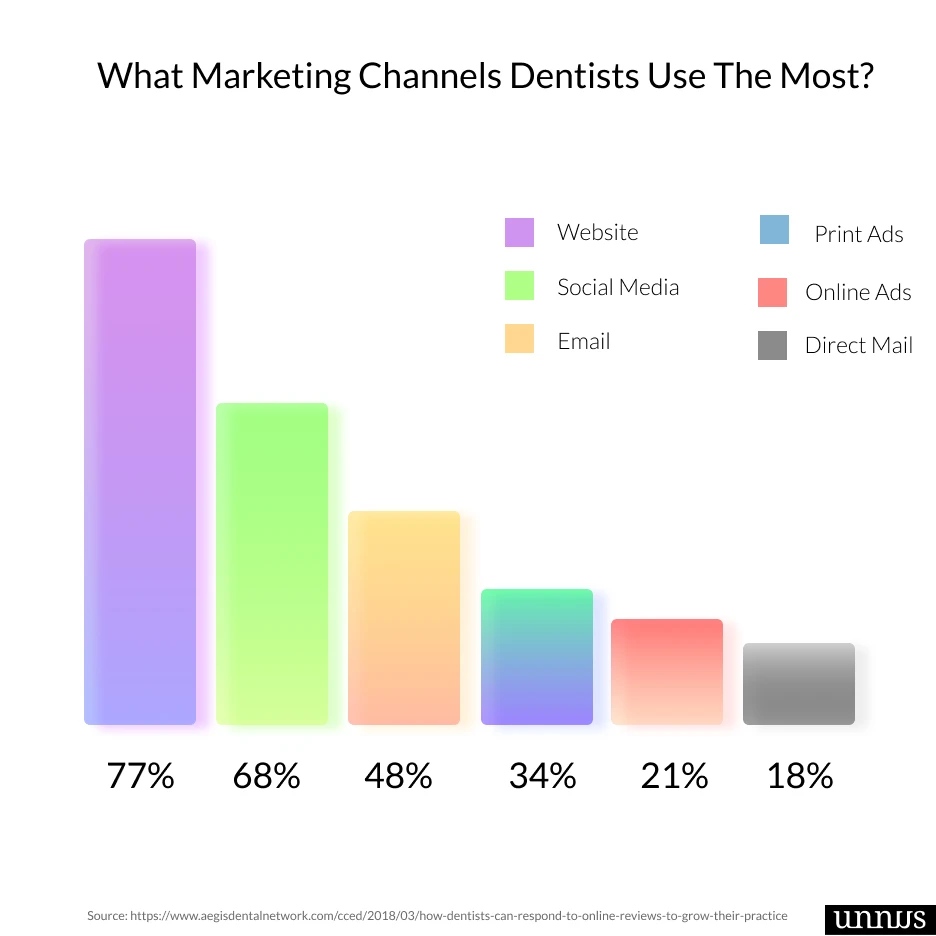
60) 77% of dentists choose websites as their first marketing channel, followed by 68% that preferred social media, 48% who used emails marketing, 34% print ads, 21% used digital advertising platforms, and 18% for direct mails. [12]

61) Dental implant market is estimated to be $5.1 billion and is expected to shoot up to a $7.97 billion by 2025 [13]

62) Dental implants have a 97% success rate [14]

63) More than 3,000,000 (3M) of floss is bought in North America each year. [3]

64) 64.3% of healthcare companies do not use patient data to measure their performance. [15]
Dental Patients Facts

65) Patients’ comfort level for dental visits depends on the type of procedure [9]

66) 3/4 of adults experience dental anxiety or fear. [16]

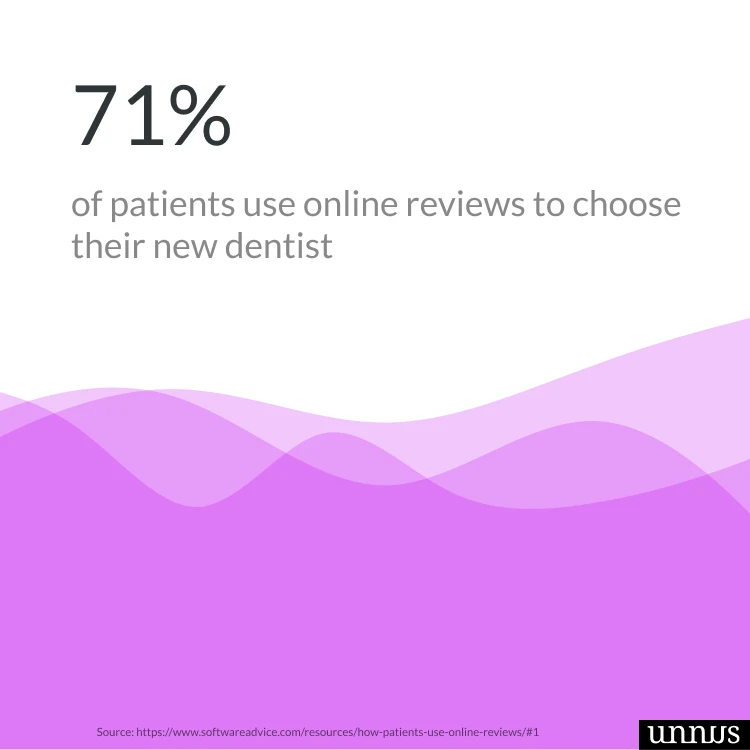
67) 3/4 of patients use web reviews to choose new dentist. [17]

68) More than half of patients will switch medical providers for better online service. [18]

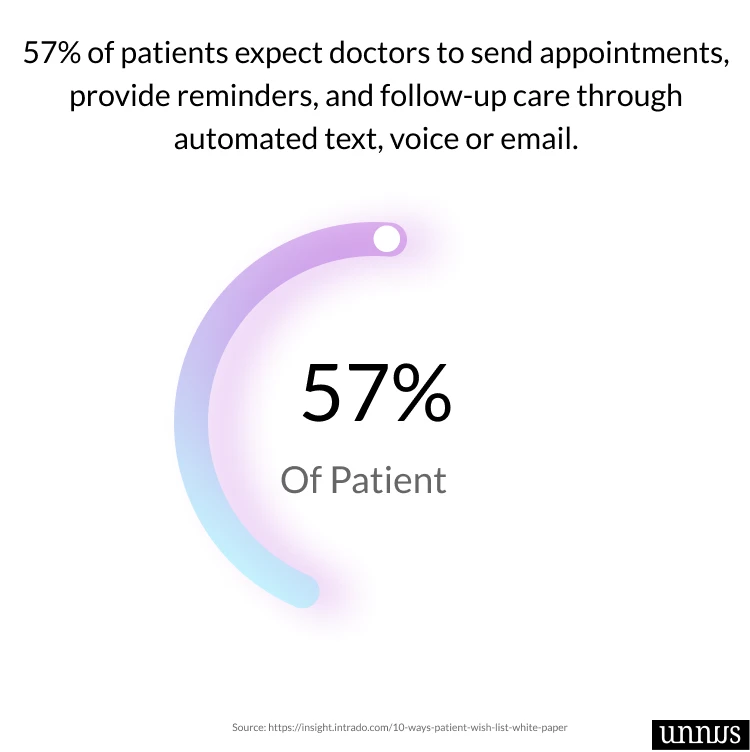
69) 57% of patients anticipate medical professionals to make appointments, reminders, and follow-ups via text automation, voice or email. [19]

70) Patients who have membership plans are likely to visit the dentist two to three times more frequently than uninsured patients and accept twice the amount of treatment. [12]

71) In a survey of 1005 adults, most Americans said that they used a multiple ways of methods of getting rid of the food in their teeth: fingernails (61%), cards (40%), cutlery (21%), pins (14%), and strands of hair (7%). [20]

72) In adults, 16% said that they flossed at least 1 time a day, 20% said they flossed when they needed to and 8% said that they never did floss. The reasons for not flossing was that it takes a lot of time (55%), 16% said it was pain-inducing and 9% said they find it repulsive. [20]

73) Among adults aged 20-64, 91% had decayed teeth areas and 27% had permanently damaged areas in thier teeth. [21]

74) More than 90% of bad breath originates in the mouth. [2]

75) People who drink ~4 cups of soda daily are 62% likely to suffer from tooth loss. [2]

76) The average person brushes 44-70 seconds/day while the recommended time is 2-4 minutes. [22]

77) People who smoke are 2.7 times more likely to develop periodontal disease. [3]

78) People with periodontal disease are 2X more likely to develop heart disease. [3]

79) 90% of system diseases have oral manifestations. [3]
Dental Profession Facts And Statistics

80) The average dentist’s age was 49 in 2020. [5]

81) Dentists’ average age at retirement was 68.2 in 2020. [5]

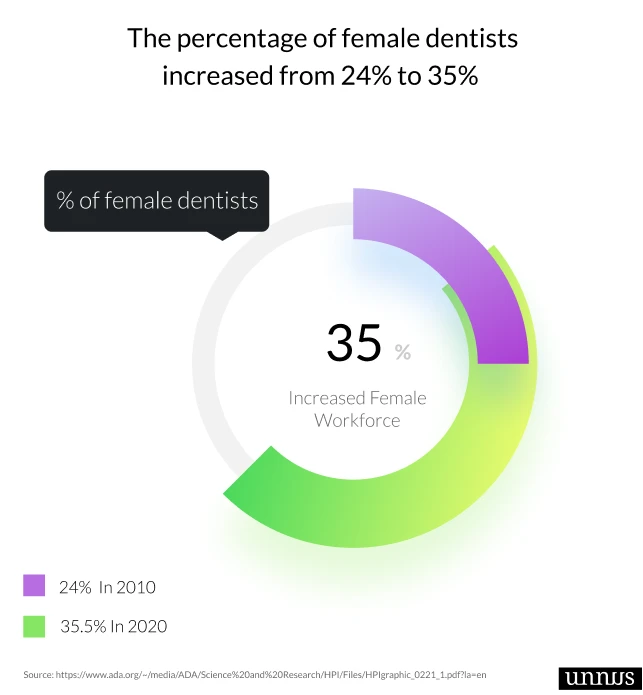
82) The percentage of female dentists in the workforce increased from 24% to 35%. This increase is expected to continue for several more years, as is evident in the growth of the proportion of female dental school graduates. [5]

83) 50% of private practice dentists work solo. [5]

84) Female dentists have been consistently less likely than male dentists to own their practice. [5]

85) Fewer dentists are working as solo practitioners. About 2 in 3 dentists were in solo practice in 1999. That proportion decreased to 1 in 2 in 2019. [5]

86) The average general practitioner wait times increased to 7.9 days for new patients and 5.9 for a patient of record. [5]

87) dentists are increasingly practicing in groups, particularly younger dentists. In 2019, only 1 in 4 dentists under 35 was in solo practice. [5]

88) The average net income has increased over the years for both general practitioners up to $204,710 and specialists up to $343,410. [5]

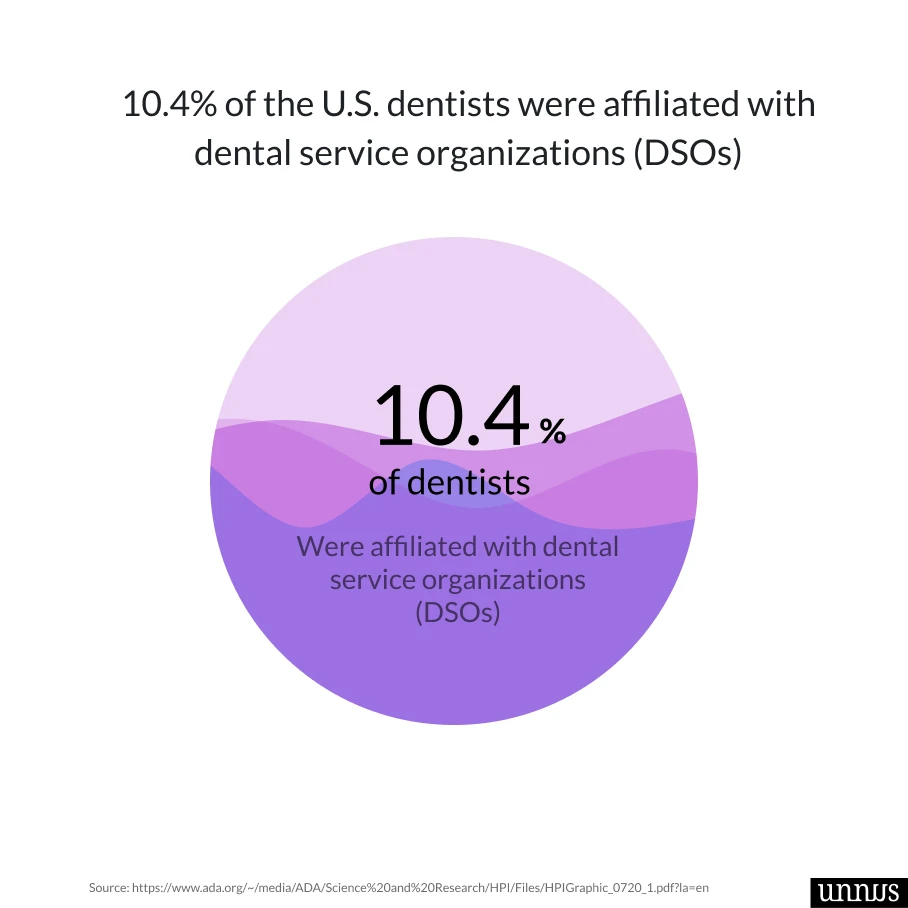
89) 10.4% of the U.S. dentists were affiliated with dental service organizations (DSOs) in 2019. [5]
Statistics About Dental Conditions

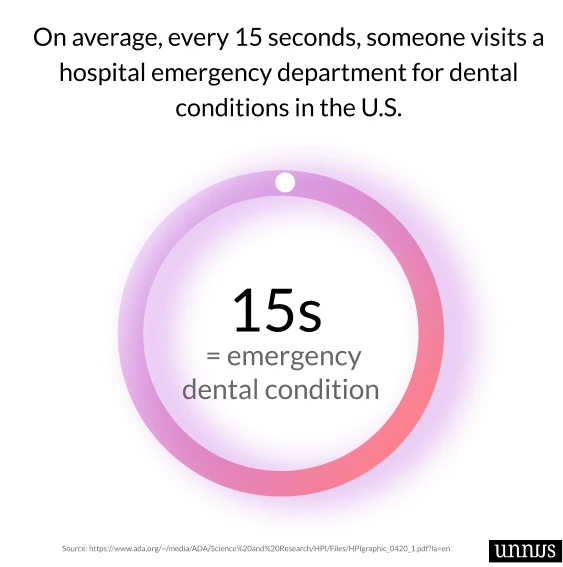
90) On average, every 15 seconds, someone visits a hospital emergency department for dental conditions in the U.S. [5]

91) 2.1 Million is the total number of hospital emergency department visits for dental conditions in the United States. [5]

92) 70% of hospital emergency department visits for dental conditions occurring outside of normal business hours. [5]

93) $2.7 Billion is the total amount of dollars spent on hospital emergency department visits in the U.S in 2017. [5]

94) 40% of hospital emergency department visits for dental conditions among adults in the United States are paid for by Medicaid. [5]

95) 69% of hospital emergency department visits for dental conditions among children in the United States are paid for by Medicaid. [5]
